|
Mixed layer cooling response of quasi-geostrophic oceanic vortices to tropical cyclone forcing
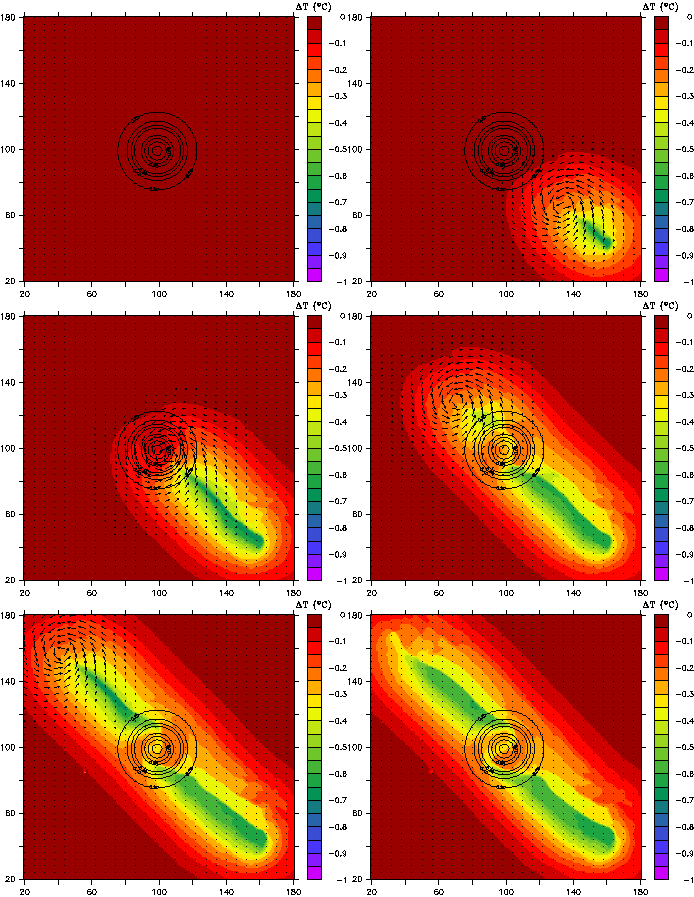
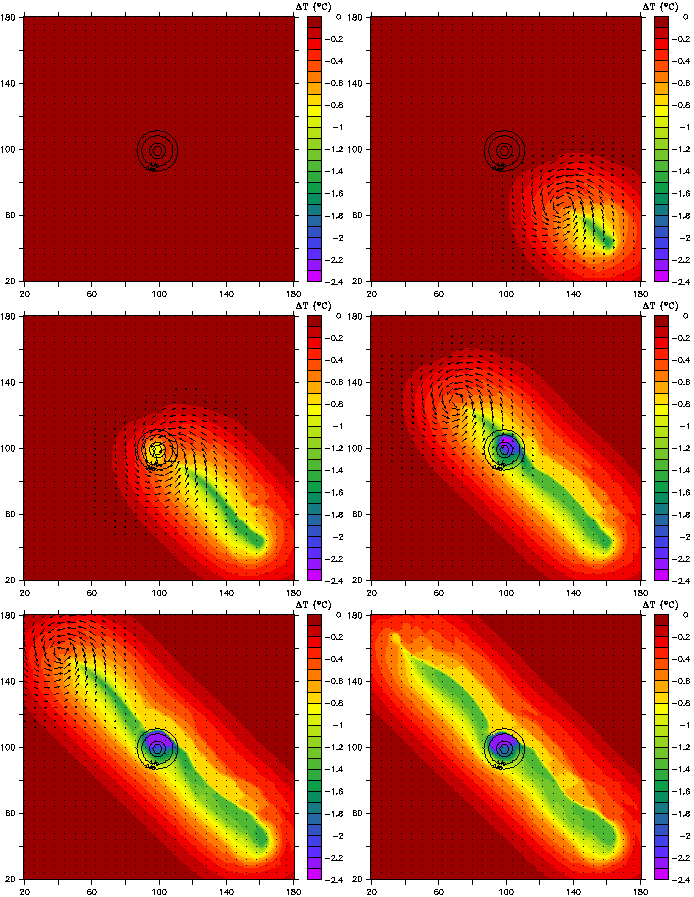
Animations presented below underscore the contrasting mixed layer cooling response (ΔT) of quasi-geostrophic oceanic vortices to tropical cyclone forcing (note the different temperature scale in the two animations). These animations are from simulations with the Miami Isopycnic Coordinate Ocean Model (MICOM) using the same wind forcing (see below).
Reduced mixed layer cooling in a warm core eddy (anticyclone, or WCE)

|
Enhanced mixed layer cooling in a cold core eddy (cyclone, or CCE)

|
The model approach in these simulations is (Jaimes et al. 2011):
- Buoyancy fluxes are ignored both in the density equation and in the turbulent kinetic energy (TKE) equation (for consistency) because the interest is to isolate the oceanic mixed layer (OML) response due to internal oceanic processes, which have been proven to drive most of the tropical cyclone-induced OML cooling.
- The turbulence closure for the OML only considers: (i) instantaneous wind erosion by the wind-driven frictional velocity, and TKE production by vertical shear instability at the OML base and over the stratified ocean below. This hybrid turbulence closure was chosen by reason of their mathematical simplicity, and because it provides direct physical insight on important mixing process observed over the thermocline inside a CCE impacted by the real hurricane Katrina.
- Idealized vortices (WCEs and CCEs) are initialized with an analytical model and density structures from direct measurements obtained during Katrina and Rita; these vortices satisfy the quasi-geostrophic approximation.
- An f-plane is used to prevent self-propagation of the vortices, which facilitates analyzing near-inertial responses at fixed points inside the stationary vortex. This approach cancels horizontal dispersion of near-inertial oscillations by meridional gradients in planetary vorticity. Any resulting horizontal wave dispersion is purely driven by background geostrophic relative vorticity.
- To keep the numerical experimentation as simple yet as realistic as possible, the ocean model is forced with idealized wind fields derived from direct measurements merged in the NOAA's H*Wind product. The wind field of tropical cyclone Katrina at maximum intensity over the Loop Current system is used (category 5 hurricane on 2230 UTC August 28, 2005). Based on this snapshot, constant wind fields were derived. The storm moves along a straight track at an angle of 45° from true north. Using a realistic, constant translation speed of Katrina of 6.3 m/s, wind fields were constructed at 30-min intervals along the storm track. Linear interpolation from these 30-min wind fields is used to force the model every baroclinic time step (180 s).
Reference
Jaimes, B., L. K. Shay, and G. R. Halliwell, 2011: The response of quasigeostrophic oceanic vortices to tropical cyclone forcing. J. Phys. Oceanogr., 41, 1965-1985. PDF


